
Query Monitor is by far the best thing for a WordPress developer. It’s billed as the “Developer Tools panel for WordPress”, and that’s a good way to put it. If you’ve ever used the browser developer tools, you know what to expect.
Query Monitor is a good way to figure out problems in Relevanssi searches, as it’s the easiest way to see the database query Relevanssi is doing. That’s a good way to find out if there are unexpected filtering rules or something like that blocking posts from the results.
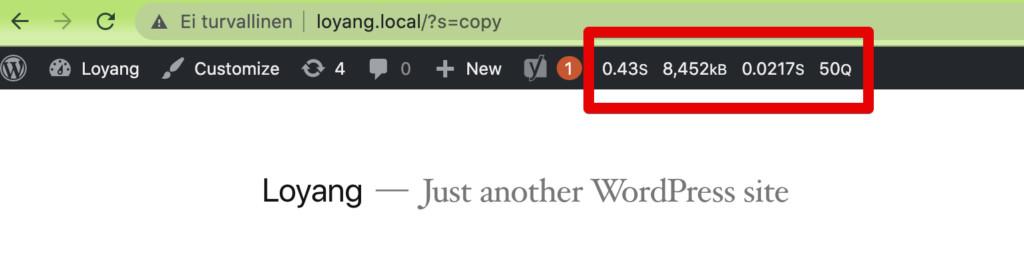
After you install Query Monitor from the plugin repository and activate it, it shows up in your admin bar:
Clicking the admin bar output opens up the Query Monitor panel and from there, you can access all sorts of information. When debugging Relevanssi searching issues, we’re mostly interested in the Queries part, and you can set the “Caller” to relevanssi_search() to exclude all non-Relevanssi queries.
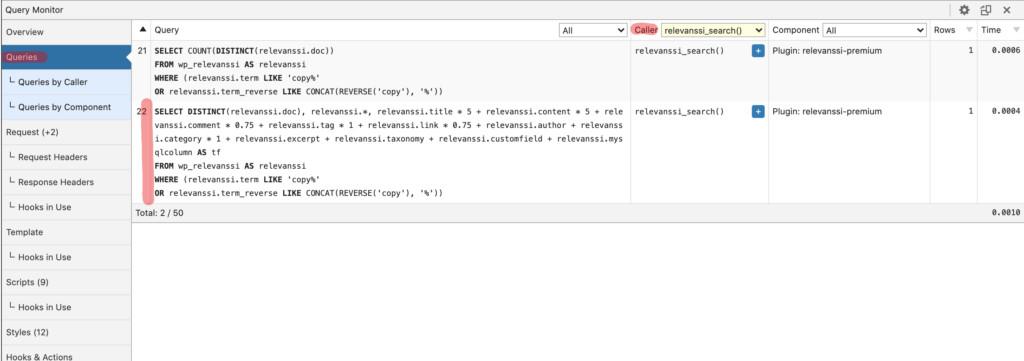
The highlighted query that begins with SELECT DISTINCT(relevanssi.doc) is the main Relevanssi search query and the one we’re interested in, as all search filters that affect the search query (taxonomy filters, custom field filters, date filters and so on) will appear there. This here is a very basic query, it just looks for posts with the search term “copy”.
This query can also point out some problems with the weights. The weights for titles, content and so on appear in the query: you can see in the beginning there’s relevanssi.title * 5 + relevanssi.content * 5 + relevanssi.comment * 0.75 and so on. This means the titles and content have a weight of 5, while comments have a weight of 0.75. Having a 0 weight for titles or content is a fairly common problem that can be spotted from the query.
This is the most relevant part in Query Monitor for Relevanssi debugging use, but the plugin is a treasure trove of useful debugging information, and every WordPress developer should always use this plugin.